Technical Development - Completed November 29, 2012
Monitoring Earth Surface Changes from Space
Final Report
Jean-Philippe Avouac
California Institute of Technology
Campus Lead

Paul Rosen
Jet Propulsion Laboratory
JPL Lead
Co-PIs:
- Essam Heggy - JPL PI
- Sebastien Leprince, Mark Simons, Pablo Ampuero, Mike Lamb - Caltech PIs
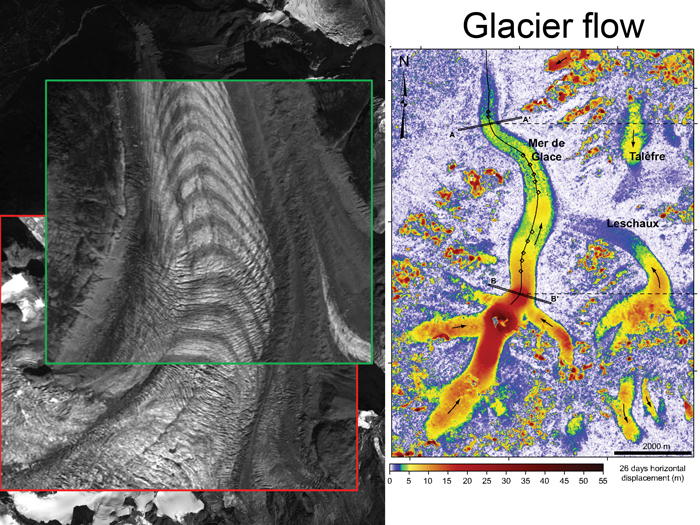
Figure 1: Glacier flow
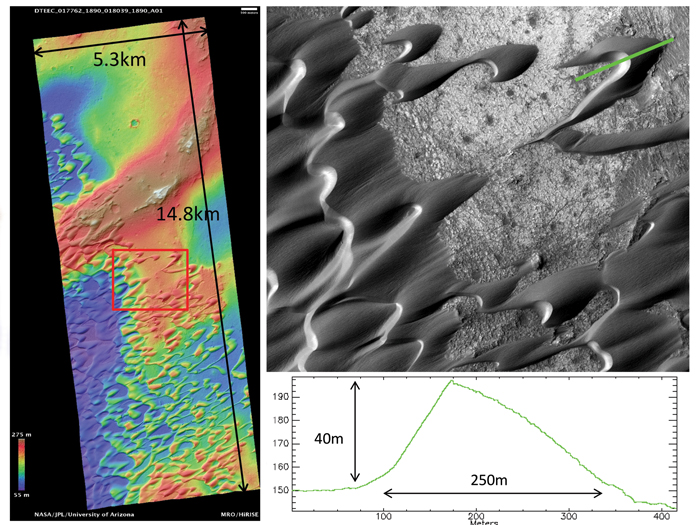
Figure 2: Sand Dunes Migration on Mars
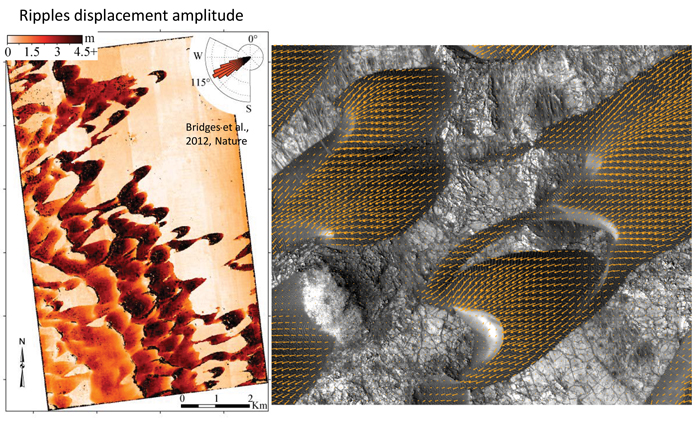
Figure 3: Measurement of ripple migration (amplitude and direction). Orthorectification, coregistration, and correlation done with COSI-Corr

Figure 4: Perspective view of NiliPateradune field (8.8°N, 67.3°E). HiRISEimage has been draped over the Stereo DEM (Digital Elevation Model). The scene size is roughly 2.5×2.5 km (~1.5×1.5 miles) and the maximum dune height is 60 meters. Colors correspond to the amplitude of the ripple's displacement extracted by image correlation between two HiRISEobservations separated by 105 days. Cool colors (blue) correspond to less than 75 cm of displacement whereas warm colors (red) correspond to 4.5+ meters. A clear dependanceof amplitude displacement with the dune height is observed.
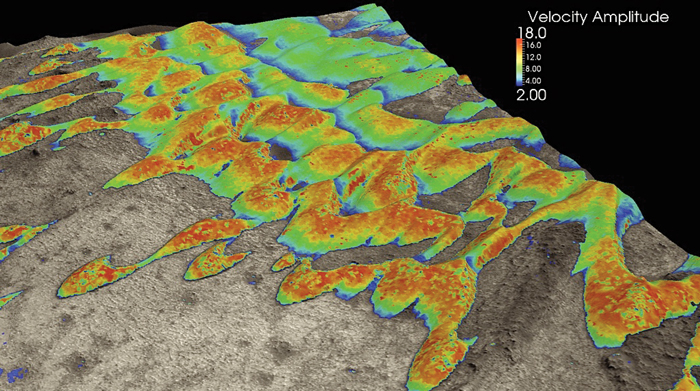
Figure 5. Perspective view of NiliPateradune field (8.8°N, 67.3°E). HiRISEimage has been draped over the Stereo DEM (Digital Elevation Model). The scene size is roughly 2.5×2.5 km (~1.5×1.5 miles) and the maximum dune height is 60 meters. Colors correspond to the amplitude of the ripple's displacement extracted by image correlation between two HiRISEobservations separated by 105 days. Cool colors (blue) correspond to less than 75 cm of displacement whereas warm colors (red) correspond to 4.5+ meters. A clear dependanceof amplitude displacement with the dune height is observed.
Overview
Activities were organized under five different themes, each lead by a different PI:
- Optical Image Time-Series (PI: Sebastien Leprince)
These activities developed techniques to analyze optical images acquired by different imaging systems and at different times to look at general landscape evolution (evolutions due to tectonic activity, glacier flow, landslides, sand dunes migration, etc.). They also buillt a framework for large scale processing to look at global changes.
- SAR Time-Series Analysis (PI: Mark Simons)
This group developed techniques to analyze radar image time series, in particular via interferrometric techniques. These activities involved close interactions with JPL via the ARIA project (PI: Susan Owen).
- Seismic Waves Imaging (PI: Pablo Ampuero)
This sub-team developed techniques for seismic inversion with dense measurement in time and space, such as measurement that would be provided by a space seismometer. These activities also involved close interactions with JPL, which received a matching R&TD funding to investigate the development of a space optical seismometer (PI: David Redding).
- Sub-surface Imaging (PI: Essam Heggy)
These activities involved close interactions at testing the possibility of an Earth orbiting Ground Penetrating Radar (GPR). Within the scope of this project, only airborne applications were sought after, with study for space applications.
- Science Applications (PI: Mike Lamb)
This group took advantage of the techniques developed by the other groups. It also drove the technical developments and implemented the external visitor program.
In addition to the support provided by the Keck Institute for Space studies, these activities are supported by matching funds from the Gordon and Betty Moore Foundation (PI, J.P. Avouac), from UAE and Kuwait (PI, E. Heggy), and from the MDAP NASA program (PI, Nathan Bridges).
